
Desmos walkthrough
SAT Desmos Regression: Build a Linear Model from a Table
Enter an original four-point table, type a linear regression, check slope and intercept, and distinguish fitting from prediction.
Reviewed
The short answer
Regression fits a chosen model to data. In Desmos, enter values in a table and use a tilde with the table’s column variables, such as y_1 ~ m x_1 + b, to fit a line. Confirm that a line is appropriate, interpret the parameters in context and distinguish a model prediction from an observed value. An exact fit in a teaching example does not guarantee future outcomes.
On this page
Enter this original data table
Add a table and enter the four pairs below in columns x₁ and y₁.
| x₁ | y₁ |
|---|---|
| 1 | 9 |
| 2 | 13 |
| 3 | 17 |
| 4 | 21 |
The labels are the table’s variables, not ordinary x and y. Desmos’s table names may increment if you already have another table; use the names actually shown.
Type the regression model
In a new expression line, type:
y_1 ~ m x_1 + b
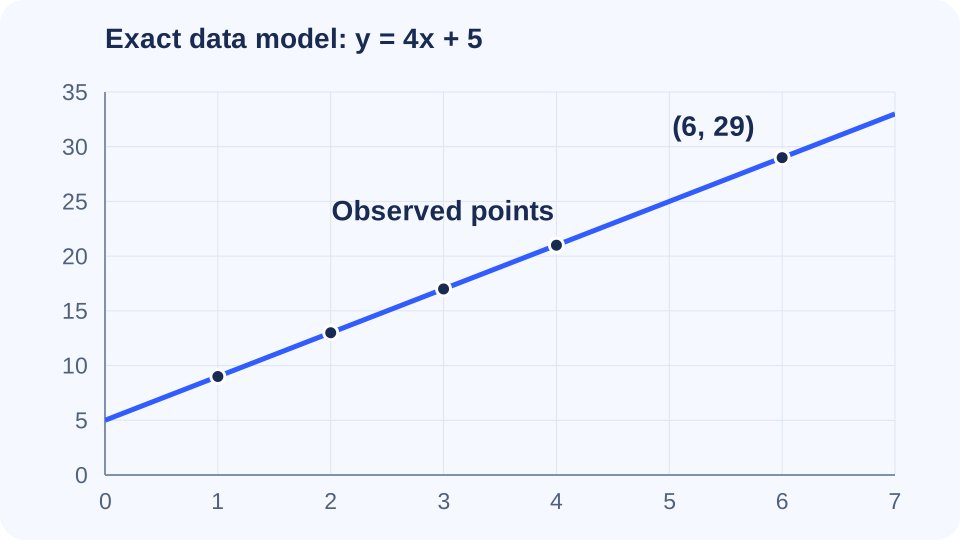
The underscore creates the subscript, and the tilde requests a fit. This exact table gives m = 4 and b = 5. The fitted equation is y = 4x + 5. You can also use a regression template where available; typing the custom model makes the chosen form explicit.
Check the coefficients independently
Consecutive points differ by 1 in x and 4 in y, so the slope must be 4. Substitute (1,9): 9 = 4(1) + b, giving b = 5. Every point satisfies y = 4x + 5, so all residuals are zero for this deliberately exact example.
Evaluate a prediction and its limits
Define f(x) = 4x + 5 and enter f(6). The model predicts 29. Because x = 6 lies beyond the observed x-range from 1 to 4, this is extrapolation. The problem may ask for the model’s prediction, but an actual future measurement need not equal it. A fitted association alone does not establish causation.
Try a new table before fitting
For (1,7), (2,10), (3,13) and (4,16), the constant rate is 3 and the intercept is 4. Enter the table and fit the same linear model: y = 3x + 4. At x = 5 the predicted y-value is 19. If the data are visibly curved, investigate the requested model rather than choosing a line automatically.
Sources
- Desmos: Regressionshelp.desmos.com
- Desmos: Tableshelp.desmos.com
- Desmos: College Board testing calculator differences, 2026–2027desmos.com
Sources are linked for reference; they do not endorse PeakSAT. How we prepare our guides