
Desmos walkthrough
SAT Desmos Window Settings: Find Hidden Intersections and Set Angle Units
Use original examples to choose graph bounds, locate a large-coordinate solution and distinguish degree and radian settings.
Reviewed
The short answer
If a graph does not show the point you need, change the viewing window before concluding that there is no solution. Desmos lets you set minimum and maximum values for each axis. Use the problem’s scale or a quick estimate to choose bounds. For trigonometry, select degrees or radians to match the angle unit in the problem.
On this page
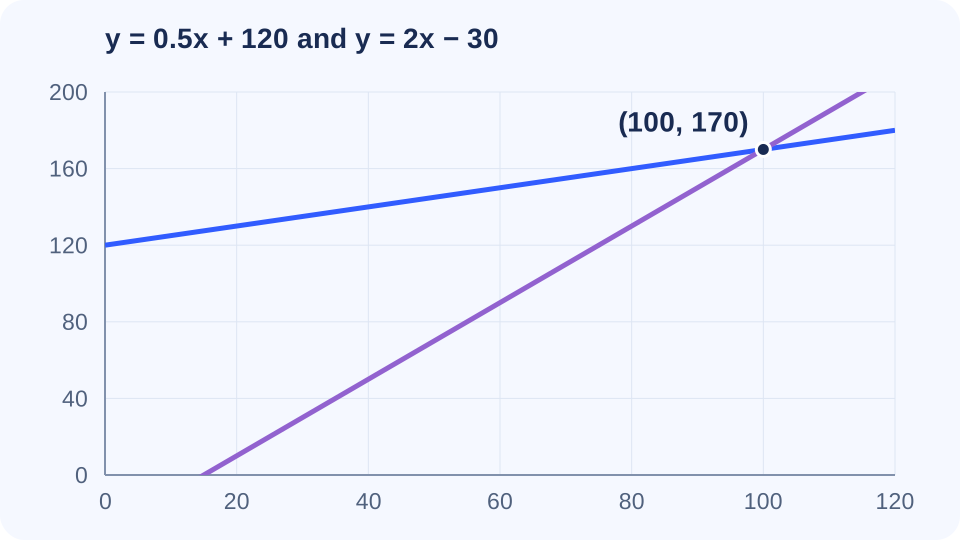
Choose a window from the task
- Use context limits for x: time cannot be negative in a model that defines time after an event.
- Estimate the expected y-scale from coefficients or a few values.
- For a table, use Zoom Fit to display its data, then expand the view for a requested prediction.
- Check beyond the visible window when another intersection is mathematically possible.
Changing the window changes what you see, not the equation or its solutions.
Match degrees and radians
Open Graph Settings and choose the angle unit required by the problem. In degree mode, sin(30) = 0.5. In radian mode, sin(π/6) = 0.5. Both describe the same angle because 30° = π/6 radians. Typing 30 in radian mode asks for a different angle. A full turn is 360° or 2π radians.
Practice the actual testing configuration
Use Desmos testing calculators (opens in a new tab) and a Bluebook test preview. Their configuration can differ from the general public calculator. Desmos supports accessibility settings and audio trace; try the relevant options on the same device and assistive technology you intend to use. A PeakSAT illustration is a mathematical diagram, not a screenshot of the exam interface.
Check a second large-coordinate system
For y = x + 40 and y = 3x − 60, solving x + 40 = 3x − 60 gives x = 50 and y = 90. Choose bounds that include (50,90), inspect the point and substitute into both equations. This is a controlled way to practice adjusting the view.
Sources
- Desmos: Graph settingshelp.desmos.com
- Desmos: Tableshelp.desmos.com
- Desmos: College Board testing calculator differences, 2026–2027desmos.com
Sources are linked for reference; they do not endorse PeakSAT. How we prepare our guides