
Original practice · Math
SAT Scatterplots: Predict a Value from a Linear Model
Find an exact line for an original data set and interpret a predicted value with appropriate limits.
Reviewed
Before you start
Practice scatterplots with an original problem, a complete solution and a transfer check. Try the problem before reading the worked answer.
The original problem
A data table contains the pairs (1, 9), (2, 13), (3, 17), and (4, 21). A linear model fits these pairs exactly. According to the model, what is y when x = 6?
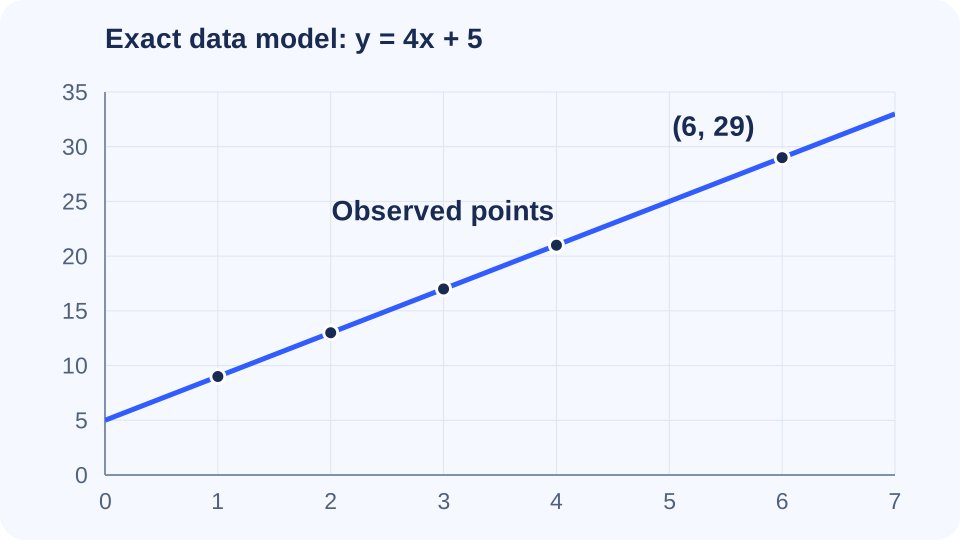
Answer: 29
Calculate the constant rate
Every increase of 1 in x raises y by 4. The slope is m = 4.
Find the intercept
Use (1,9) in y = 4x + b: 9 = 4 + b, so b = 5. The model is y = 4x + 5.
Evaluate the model
At x = 6, y = 4(6) + 5 = 29. The prompt asks for a model prediction, not an observed data value.
A second method or independent check
Enter the data in Desmos columns x₁ and y₁, then type y_1 ~ m x_1 + b. The exact data yield m = 4 and b = 5. Defining f(x) = 4x + 5 and evaluating f(6) gives 29. Check this against the hand calculation.
Why tempting answers fail
- 24 uses the slope but omits the intercept.
- 25 is the model value at x = 5.
- 33 is the model value at x = 7.
Try a transfer problem
For this model, what is the predicted difference in y between x = 6 and x = 8?
Answer: 8
The change in x is 2. Multiply by the slope: Δy = 4 × 2 = 8. Equivalently, 37 − 29 = 8.
What to practice next
If this was difficult, return to scatterplots practice and identify the precise step to improve. These are original PeakSAT teaching examples, not official College Board questions or calibrated score predictions. For official adaptive test practice, use Bluebook (opens in a new tab).
Sources
- College Board: SAT Math contentsatsuite.collegeboard.org
Sources are linked for reference; they do not endorse PeakSAT. How we prepare our guides