
Desmos walkthrough
SAT Quadratics in Desmos: Roots, Vertices and the Requested Value
Graph an original quadratic, find its two zeros and vertex, and verify each with factorization and completed-square form.
Reviewed
The short answer
A quadratic graph can show its real zeros and its vertex, but those points answer different questions. Zeros are x-values where y = 0; the vertex gives a minimum or maximum when the domain permits it. Enter the original function, inspect the appropriate point, and check exact values by factoring or completing the square.
On this page
Graph the original quadratic
Enter:
y = x^2 - 8x + 12
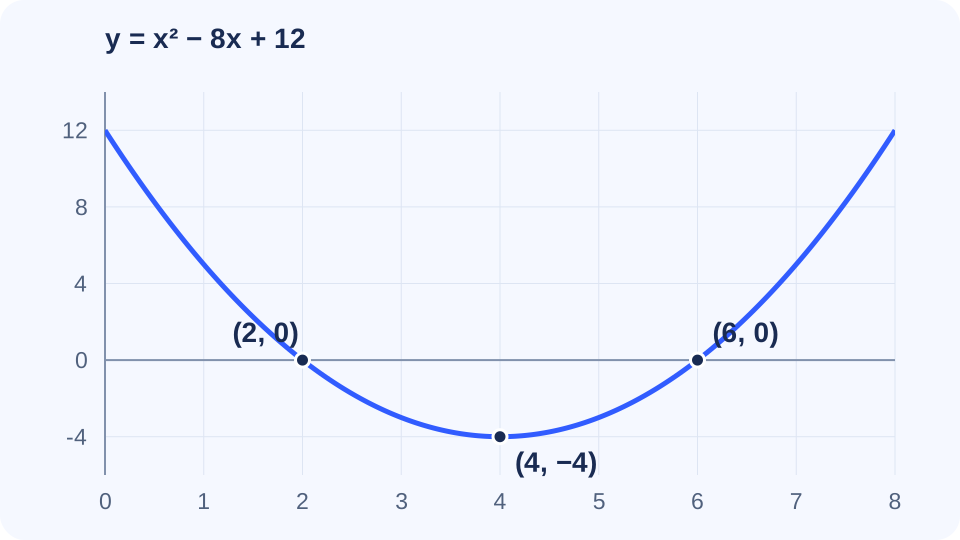
An x-window from 0 to 8 and a y-window from −6 to 14 will display both zeros and the vertex. Select the curve to show points of interest. The x-intercepts are (2,0) and (6,0); the vertex is (4,−4).
Verify roots by factoring
x² − 8x + 12 = (x − 2)(x − 6). Setting the product to zero gives x = 2 or x = 6. Their sum is 8 and their product is 12. A prompt asking for the larger solution therefore requires 6, not 8 or the vertex’s x-coordinate 4.
Verify the minimum by completing the square
x² − 8x + 12 = (x − 4)² − 4. Since the square is nonnegative, the minimum is −4 at x = 4. For a restricted domain such as x ≥ 5, that unrestricted vertex is excluded; the minimum on x ≥ 5 is instead f(5) = −3. Always apply the given domain.
An equation with a nonzero right side is an intersection task
To solve x² − 8x + 12 = 5, graph y = x² − 8x + 12 and y = 5. Their intersection x-values solve that equation. Algebra gives (x − 4)² − 4 = 5, so (x − 4)² = 9 and x = 1 or 7. Using the original quadratic’s zeros 2 and 6 would solve a different equation.
Try the next quadratic
For y = x² − 10x + 21, factoring gives (x − 3)(x − 7), so zeros are 3 and 7. Completing the square gives (x − 5)² − 4, so the vertex is (5,−4). Graph those results, then explain why the minimum y-value is −4 while the larger zero is 7.
Sources
- Desmos: Getting started and points of interesthelp.desmos.com
- Desmos: Graph settingshelp.desmos.com
- Desmos: College Board testing calculator differences, 2026–2027desmos.com
Sources are linked for reference; they do not endorse PeakSAT. How we prepare our guides