
Desmos screen walkthrough
Find a Quadratic Maximum in SAT Testing Desmos
The short answer
Watch this 58-second narrated screen walkthrough using actual captures of the College Board testing calculator. Then check the algebra and try a fresh problem.
Downloads
Files open or save in your browser. No account is needed.
On this page
Enter the model and fix the window
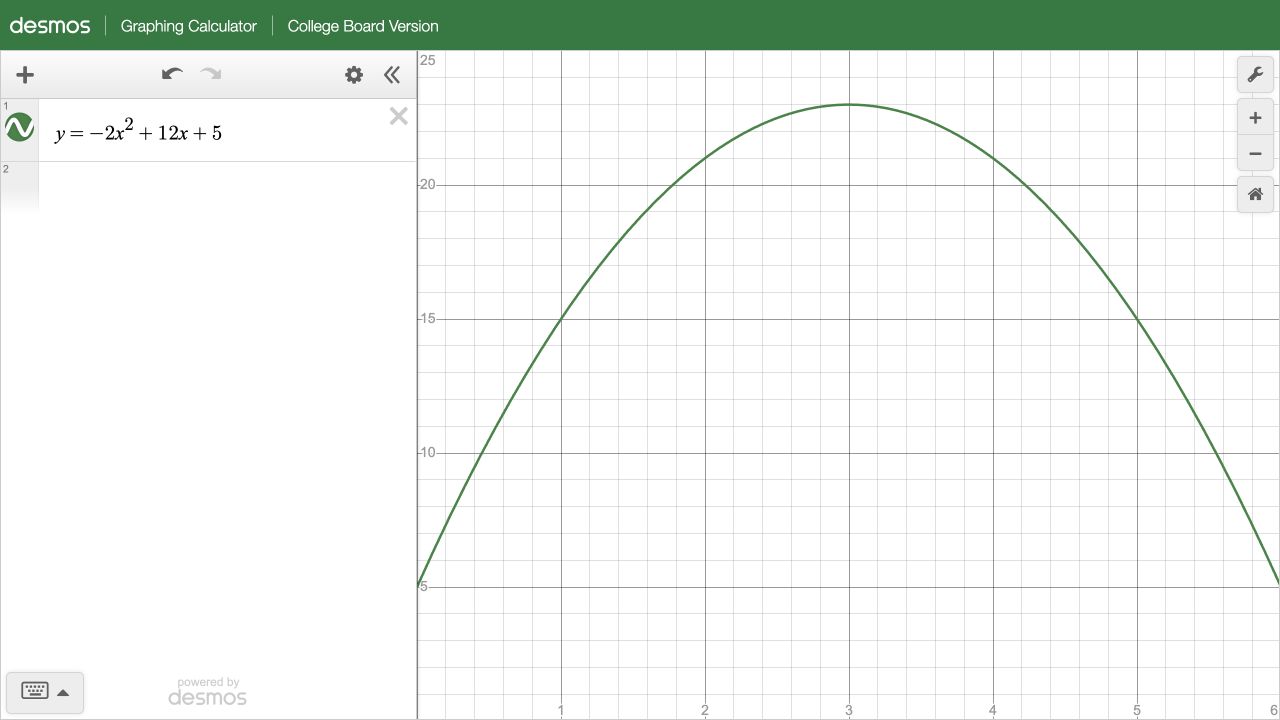
Enter y equals negative two x squared plus twelve x plus five. The original window can hide the maximum. Open Graph Settings. Set the x minimum to zero and maximum to six, and the y minimum to zero and maximum to twenty five. This window includes the allowed input interval and the top of the parabola. Changing the viewing window does not restrict the equation itself. Keep the question’s domain in mind.
Read the vertex and verify the output
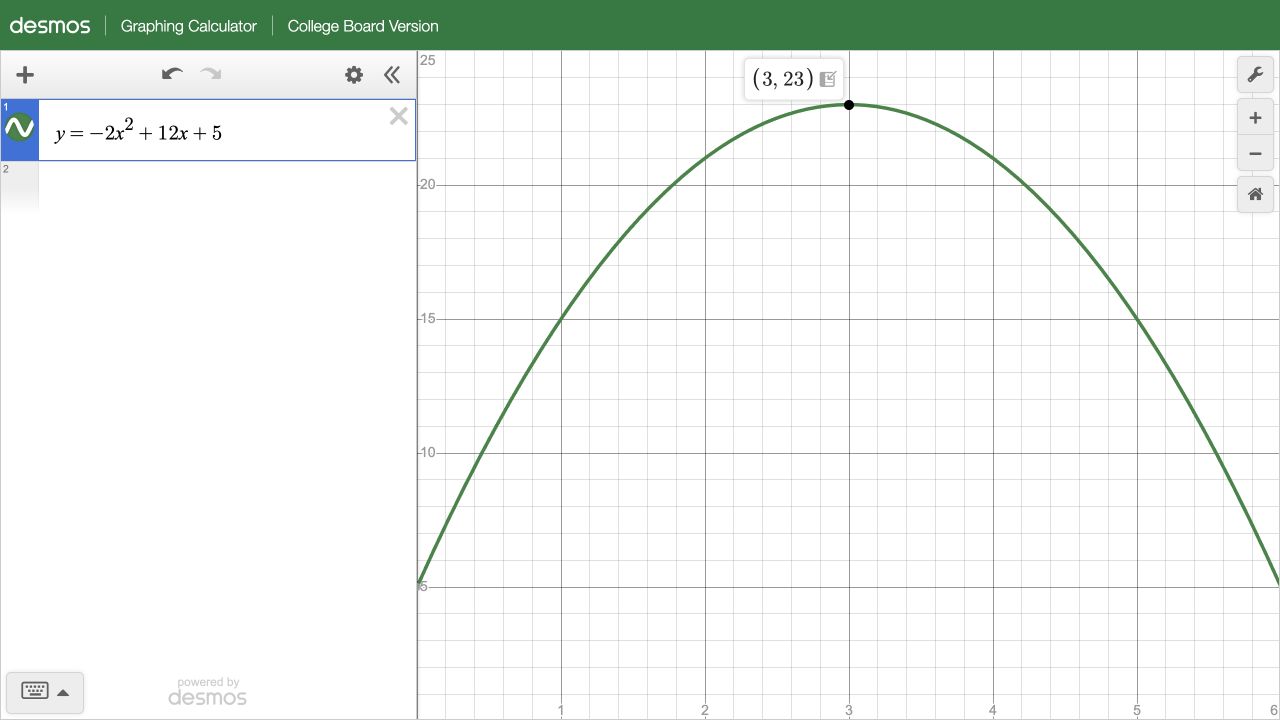
Select the curve, then tap the vertex point. The displayed coordinates are three comma twenty three. Three is the input; twenty three is the maximum output. Completing the square gives negative two times x minus three squared, plus twenty three. A negative square cannot increase that value. The permitted interval contains three, and both endpoints give five. For a different interval, check its endpoints and whether the vertex is allowed.
Verify the mathematics
−2x² + 12x + 5 = −2(x − 3)² + 23. On 0 ≤ x ≤ 6, the vertex at x = 3 is allowed and y = 23 is maximal. At x = 0 and x = 6, y = 5.
Try a fresh check
On 0 ≤ x ≤ 2, what is the maximum of the same model? The vertex x = 3 is outside that interval. The function is increasing there, so the maximum is y(2) = 21, not 23.
Complete video transcript
Enter y equals negative two x squared plus twelve x plus five. The original window can hide the maximum. Open Graph Settings. Set the x minimum to zero and maximum to six, and the y minimum to zero and maximum to twenty five. This window includes the allowed input interval and the top of the parabola. Changing the viewing window does not restrict the equation itself. Keep the question’s domain in mind.
Select the curve, then tap the vertex point. The displayed coordinates are three comma twenty three. Three is the input; twenty three is the maximum output. Completing the square gives negative two times x minus three squared, plus twenty three. A negative square cannot increase that value. The permitted interval contains three, and both endpoints give five. For a different interval, check its endpoints and whether the vertex is allowed.
How this walkthrough was made
The video presents actual calculator screen captures with Google-generated narration. It is a narrated sequence of captured steps. Captures were checked on October 13, 2026 in the College Board testing configuration. Captions are timed by the measured narration segments; sentence timings within a segment are approximate. Desmos and College Board do not endorse PeakSAT.
Guided practice with the testing calculator
Work each problem in the official calculator, then enter your values here to check them.
Open the College Board testing calculator (opens in a new tab)
Separate the input from the maximum
For y = −2x² + 12x + 5 on 0 ≤ x ≤ 6, find where the maximum occurs and the maximum output. Use a window that includes the vertex.
Hint
The displayed vertex gives an input and an output. The question asks for both.
Explanation
Completing the square gives −2(x − 3)² + 23. The vertex is (3, 23), and x = 3 is in the allowed interval. Both endpoints give 5, so the maximum is 23 at x = 3.
Change the allowed domain
Use the same model, but now only 0 ≤ x ≤ 2 is allowed. Find the input and maximum output on this interval.
Hint
A visible vertex outside the allowed interval is not an allowed answer. Check the endpoints.
Explanation
The unrestricted vertex x = 3 is outside 0 ≤ x ≤ 2. The parabola increases toward that vertex, so the interval maximum is at x = 2. The output is −8 + 24 + 5 = 21. At x = 0 the output is 5.
Original PeakSAT practice checked by hand; not an official score. Nothing you type is stored or sent.
Sources
- Desmos: practice with testing calculatorshelp.desmos.com
- College Board testing graphing calculatordesmos.com
Sources are linked for reference; they do not endorse PeakSAT. How we prepare our guides