
Desmos screen walkthrough
Use Linear Regression in SAT Testing Desmos
The short answer
Watch this 73-second narrated screen walkthrough using actual captures of the College Board testing calculator. Then check the algebra and try a fresh problem.
Downloads
Files open or save in your browser. No account is needed.
On this page
Enter data and fit with a tilde
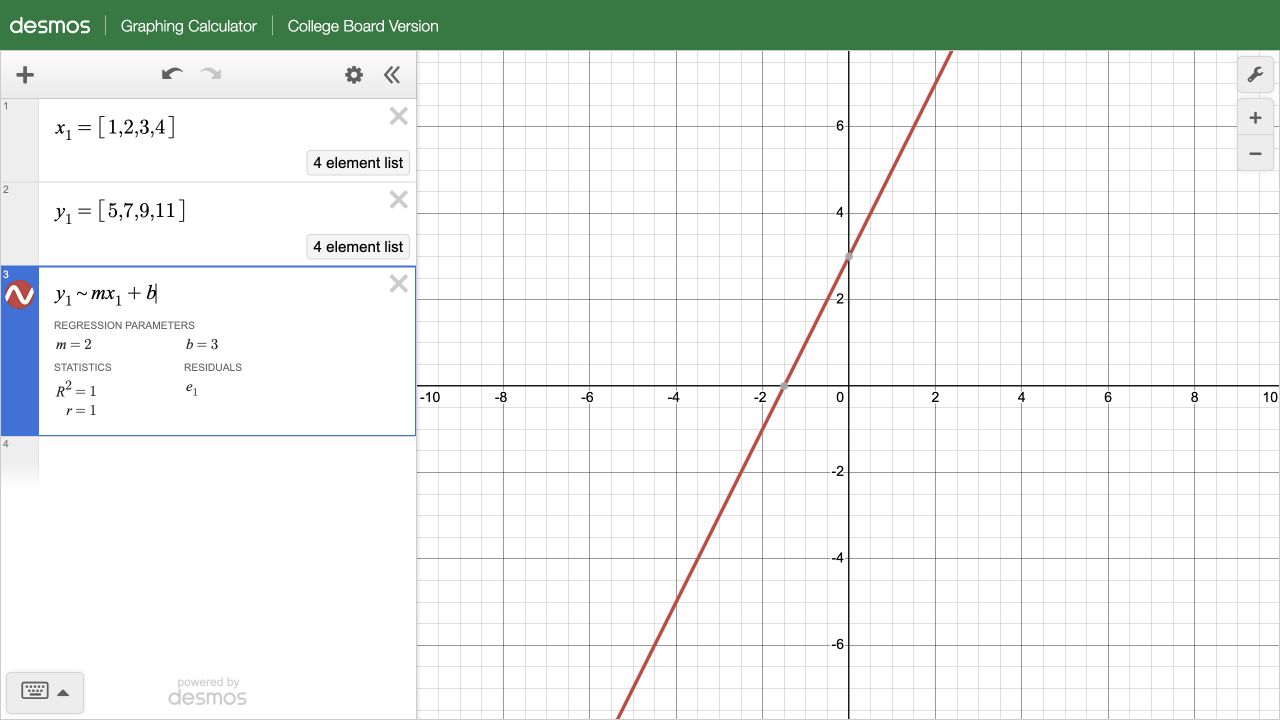
For this original example, enter x subscript one equals the list one, two, three, four. On the next line enter y subscript one equals five, seven, nine, eleven. Type y subscript one, then press the right arrow to leave the subscript. Enter tilde m x subscript one, press the right arrow again, and add b. The tilde asks Desmos to fit a model to paired data. An equals sign does not perform this regression.
Inspect the parameters and the data
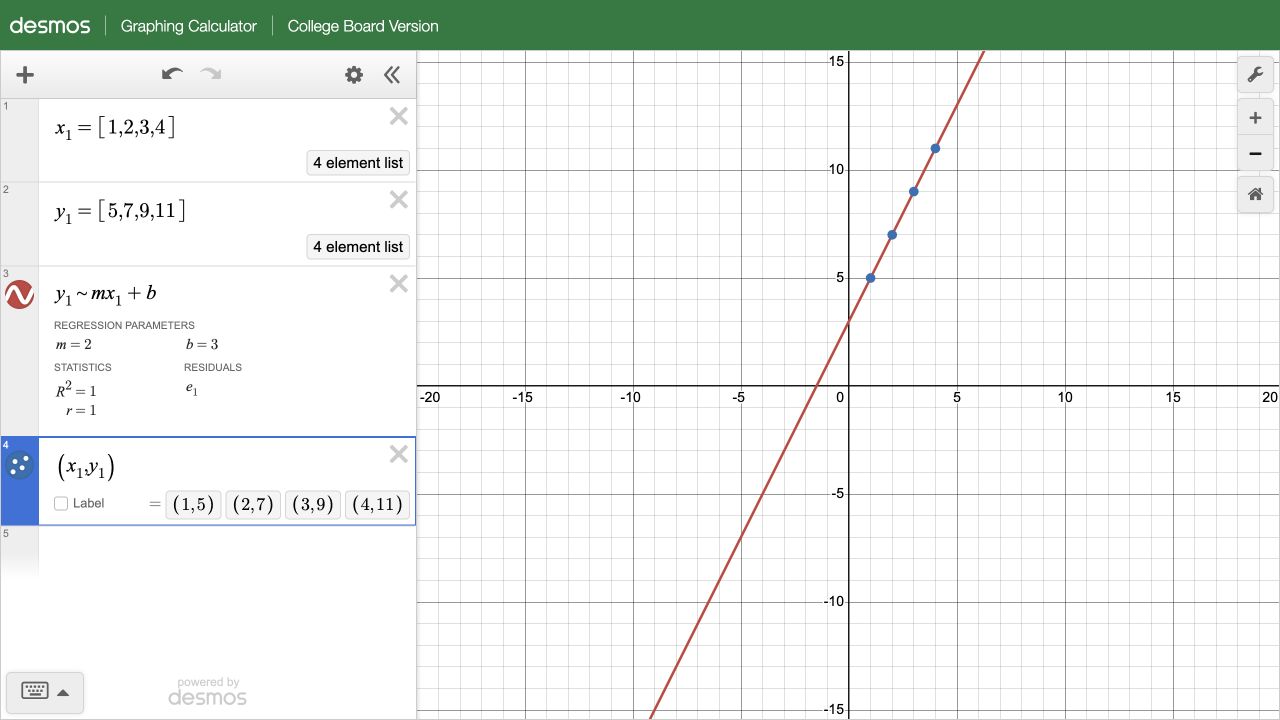
The regression parameters show m equals two and b equals three. Plot the ordered-pair lists x subscript one, y subscript one to see the four data points. Their y values increase by two each time x increases by one. Substituting the first point into y equals two x plus b gives b equals three. Here every point lies exactly on y equals two x plus three, so R squared equals one. Real data may have residuals. A fitted relationship does not establish causation or justify extrapolation beyond the studied range.
Verify the mathematics
The points (1, 5), (2, 7), (3, 9), (4, 11) all satisfy y = 2x + 3. Slope = (11 − 5)/(4 − 1) = 2 and intercept = 5 − 2(1) = 3. Perfect fit describes only these example points.
Try a fresh check
Try the points (1, 4), (2, 7), (3, 10), (4, 13). Predict m = 3 and b = 1, then verify with regression and substitution. For noisy data, inspect residuals and the context before using a prediction.
Complete video transcript
For this original example, enter x subscript one equals the list one, two, three, four. On the next line enter y subscript one equals five, seven, nine, eleven. Type y subscript one, then press the right arrow to leave the subscript. Enter tilde m x subscript one, press the right arrow again, and add b. The tilde asks Desmos to fit a model to paired data. An equals sign does not perform this regression.
The regression parameters show m equals two and b equals three. Plot the ordered-pair lists x subscript one, y subscript one to see the four data points. Their y values increase by two each time x increases by one. Substituting the first point into y equals two x plus b gives b equals three. Here every point lies exactly on y equals two x plus three, so R squared equals one. Real data may have residuals. A fitted relationship does not establish causation or justify extrapolation beyond the studied range.
How this walkthrough was made
The video presents actual calculator screen captures with Google-generated narration. It is a narrated sequence of captured steps. Captures were checked on October 13, 2026 in the College Board testing configuration. Captions are timed by the measured narration segments; sentence timings within a segment are approximate. Desmos and College Board do not endorse PeakSAT.
Guided practice with the testing calculator
Work each problem in the official calculator, then enter your values here to check them.
Open the College Board testing calculator (opens in a new tab)
Fit the original data
Use x₁ = [1,2,3,4], y₁ = [5,7,9,11] and y₁ ~ mx₁ + b. Predict the fitted slope and intercept, then check the displayed parameters.
Hint
Use the tilde for regression and leave each subscript before typing the next operator.
Explanation
Each y increases by 2 when x increases by 1, so m = 2. The first point gives 5 = 2(1) + b, hence b = 3. All four example points satisfy y = 2x + 3 exactly; that does not establish causation.
Fit a different line
Change y₁ to [4,7,10,13] while keeping x₁ = [1,2,3,4]. Find the new slope and intercept, then verify one point.
Hint
Use the change in y for each one-unit change in x, then substitute a point.
Explanation
The slope is 3, and the first point gives 4 = 3(1) + b, so b = 1. Each point lies on y = 3x + 1. For noisy real data, inspect residuals and context before predicting beyond the studied range.
Original PeakSAT practice checked by hand; not an official score. Nothing you type is stored or sent.
Sources
- Desmos: practice with testing calculatorshelp.desmos.com
- College Board testing graphing calculatordesmos.com
Sources are linked for reference; they do not endorse PeakSAT. How we prepare our guides